In this mini-project, I created a Python script (PerformanceLog.py) to record JMX values from a running Cassandra instance, using JMXTerm (http://wiki.cyclopsgroup.org/jmxterm/), and do the following:
- Put the records into a Cassandra table.
- Plot the results.
The project is based on a Cassandra interview question found on Glassdoor.
Currently, the first version only works with Windows version of Cassandra (using DataStax Community installer). Developed and tested in Python 2.7.
Input/Output
Input
When running the script from command line, the following arguments must be provided:
- installDir INSTALLDIR: Path to installation directory.
- host HOST: URL string for Cassandra instance. Only localhost tested.
- jmxTerm JMXTERM: Path to jmxterm jar file.
- osString OSSTRING: String that represents the current OS. Windows: win. Mac: mac. Unix/Linux: linux.
Example:
1
| |
Output
- CSV file with each field for each JMX metric. Example:
1 2 3 4 5 | |
- Records in a Cassandra table
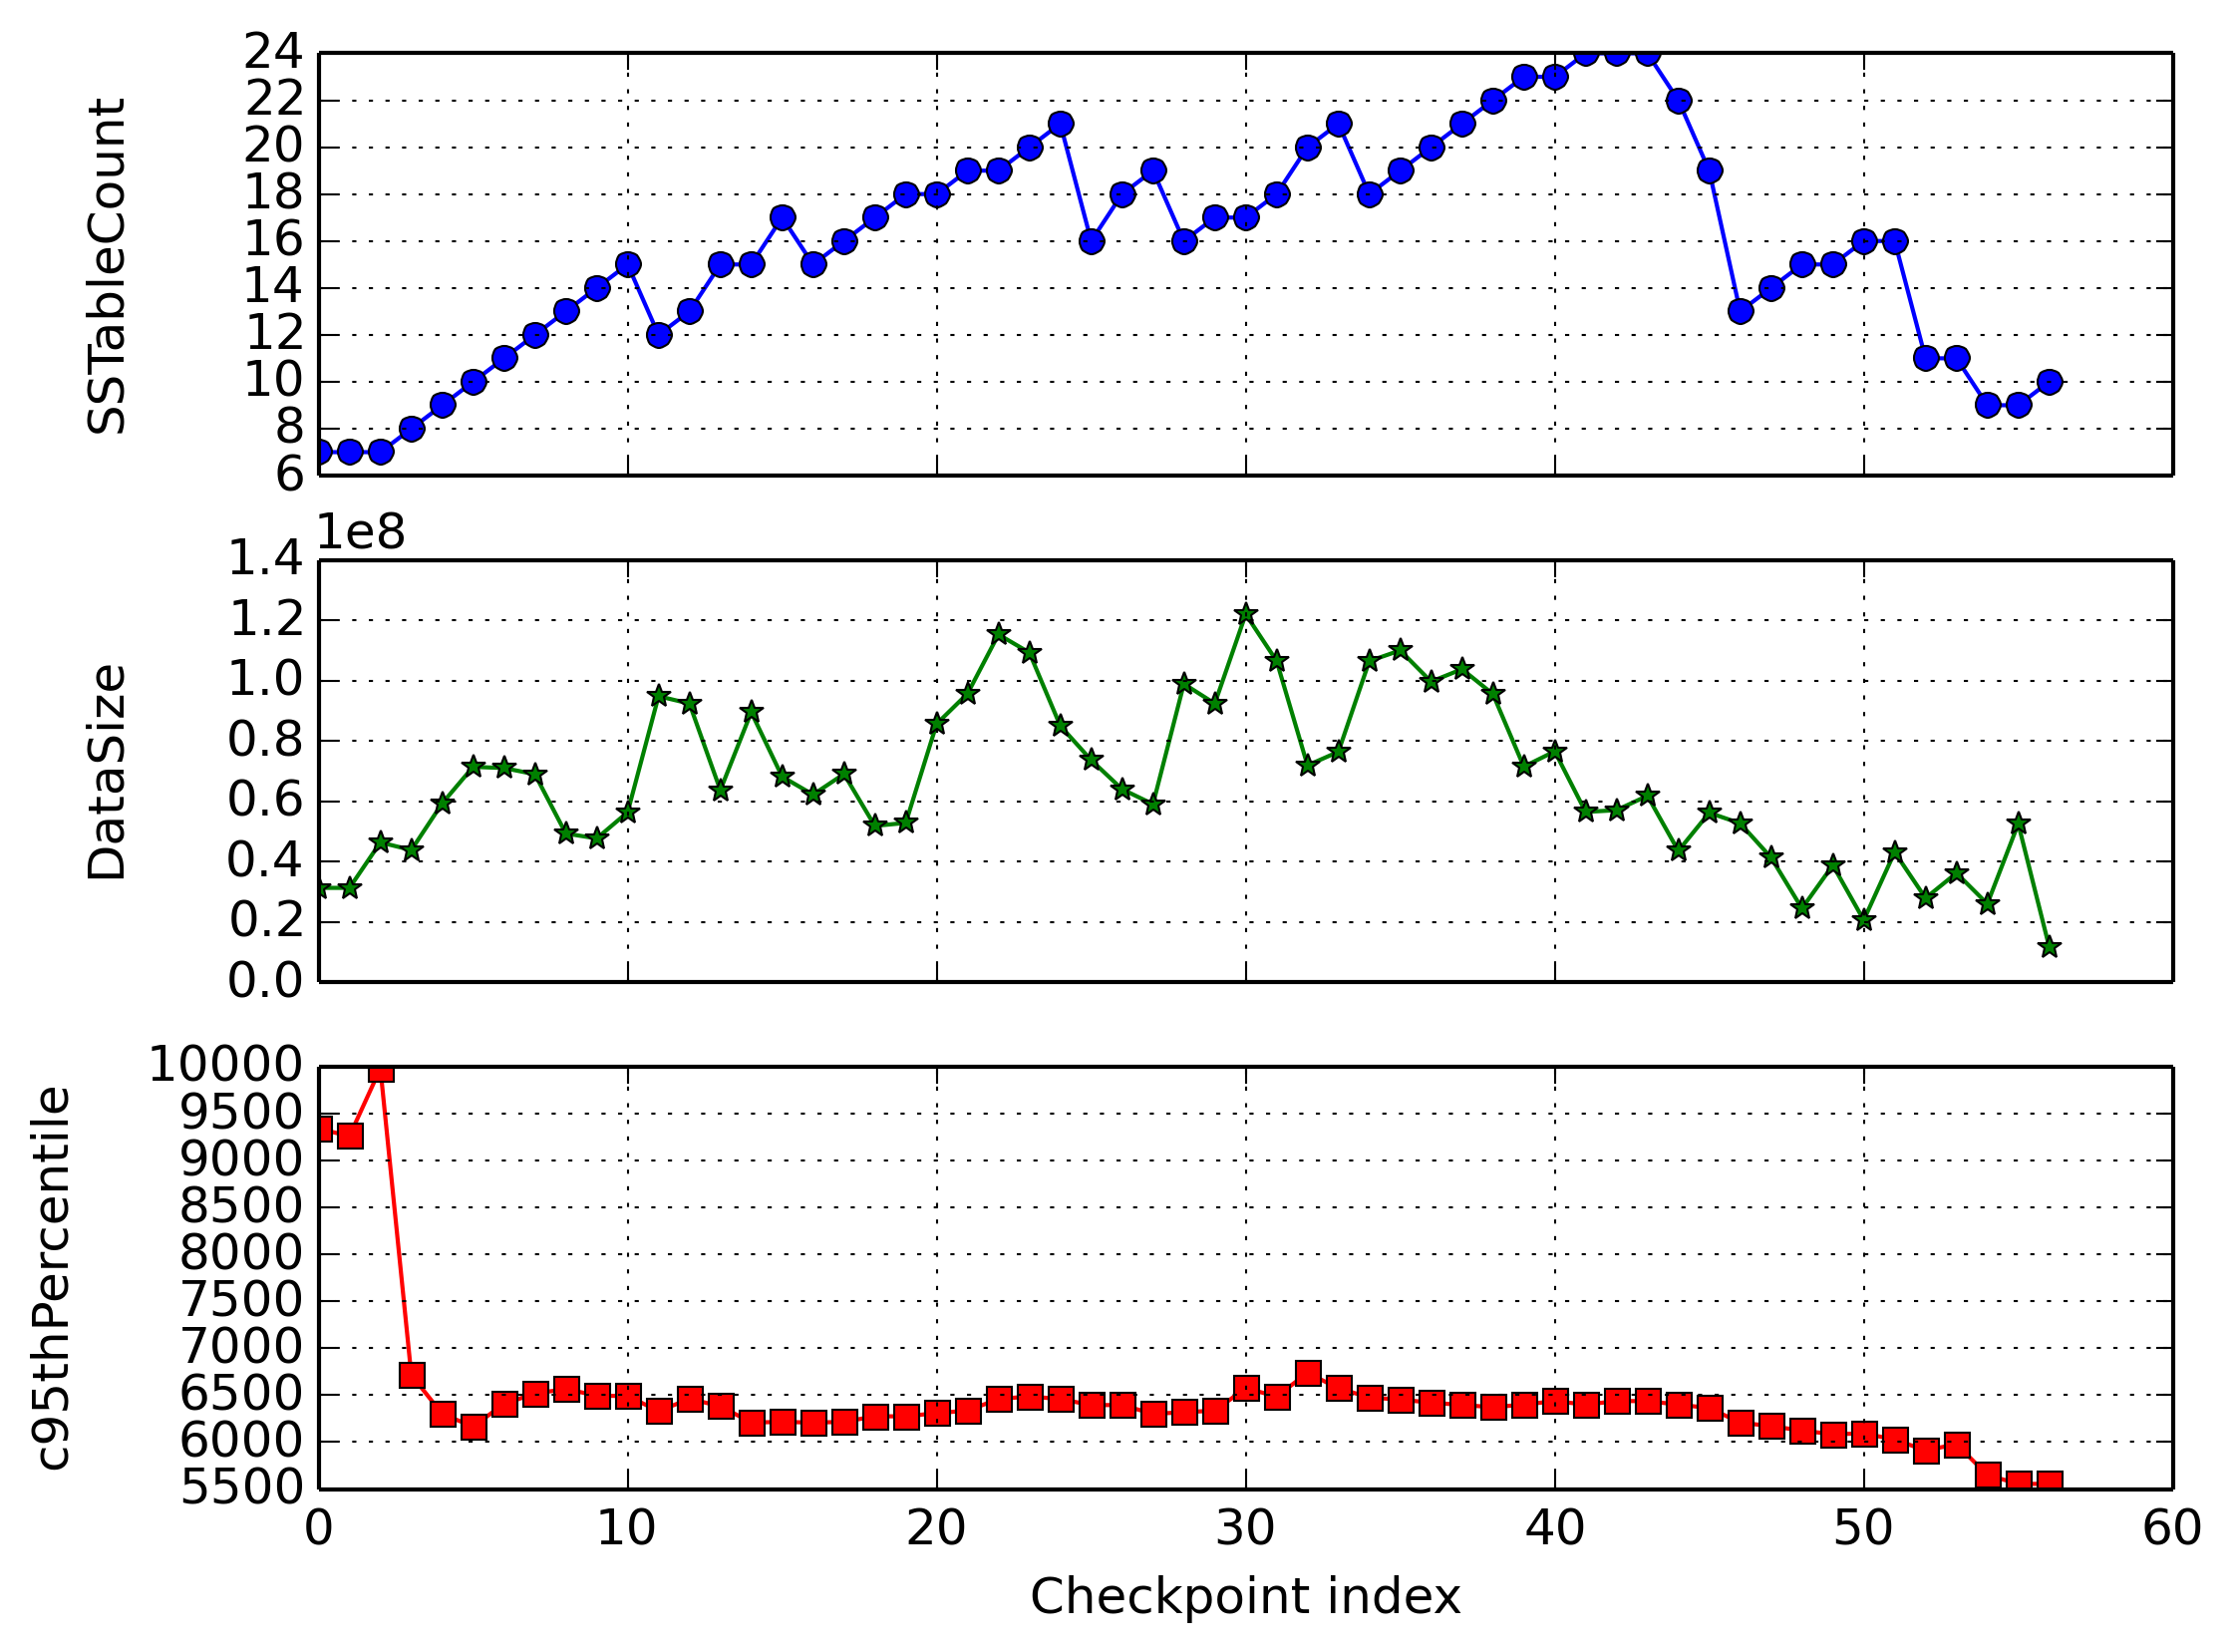
- Performance plot as PNG file (automatically generated from CSV output file). Example:

Python modules
- PerformanceLog.py: Main module to run the automated tasks. Please use “python PerformanceLog -h” for the required arguments. Example call for Windows is in the doc string.
- MyLogger.py: Logging support module
- CassandraRecord.py: Support module to record metrics into a Cassandra table.
- Plotter.py: Support module to plot metrics into plots and save into PNG file.
Automated tasks by the modules
- Check if Cassandra is Running
- Record certain JMX Metrics
- Runs the external tool Cassandra Stress
- Once the stress session has completed, stop recording JMX Metrics
- Record the metrics back into a Cassandra Table
- Graph the results (create these graphs at the end of the run).
External Python libraries required
For CassandraRecord.py
This module requires Datastax’s Python driver: http://datastax.github.io/python-driver/installation.html
For Plotter.py
This Python module used Matplotlib library. Please install the following Python libraries: matplotlib, numpy, dateutil, pytz, pyparsing, six (optionally: pillow, pycairo, tornado, wxpython, pyside, pyqt, ghostscript, miktex, ffmpeg, mencoder, avconv, or imagemagick).
Installation of these Python libraries are straight-forward on Linux and Win32. On Win64, please find their installers here: http://www.lfd.uci.edu/~gohlke/pythonlibs/
Other files
The following output files are produced. For consistency check, they are left behind. In the final version of the script, they may be cleaned up accordingly.
- tempout: Output from JmxTerm session
- jmxMetrics.csv: The cvs file that records the interested JMX metrics.
- CassandraTest.log: The log file for the script.